Table of Contents
- Why Most BOM Cost Reduction Efforts Miss the Mark
- Strategy 1: Run a Pre-Freeze BOM Cost Risk Assessment
- Component Cost Trajectory
- Single-Source Dependency
- Lead Time Exposure
- Lifecycle Risk
- Tariff and Geopolitical Exposure
- Strategy 2: Apply Total Cost of Ownership (TCO) Instead of Unit Price
- Strategy 3: Standardize Components Without Sacrificing Supply Resilience
- Strategy 4: Design In Multi-Sourcing from Schematic Capture
- Strategy 5: Reduce Engineering Research Time in Component Selection
- Strategy 6: Build Real-Time Cost Visibility Infrastructure
The conventional BOM cost reduction playbook—send the BOM to three suppliers, negotiate, place the order with the lowest bidder—is broken in 2026. When lead times stretch past 40 weeks and allocation determines availability more than price, the buyer’s negotiating leverage is fundamentally limited.
But this does not mean cost reduction is impossible. It means the highest-leverage cost reduction opportunities have shifted upstream—into the design process, the component selection criteria, and the procurement-engineering collaboration model. Here is what works.
Why Most BOM Cost Reduction Efforts Miss the Mark
Research from CircuitMind reveals a structural problem: by the time a typical procurement team begins cost optimization, 70–90% of the BOM cost has already been locked in by upstream engineering decisions—architecture, key IC selection, and component choices made during schematic design.
The three downstream levers available to procurement after design freeze are narrow:
| Cost Reduction Lever | Typical Savings | Limitations |
|---|---|---|
| Reconciliation and housekeeping (collapsing passive values, reducing supplier sprawl) | 1–3% | Does not touch the components driving meaningful cost |
| Procurement engineering substitutions (footprint-compatible drop-ins, package migrations) | 2–7% | Thermal margins, firmware coupling, and PCB constraints limit scope |
| Supplier negotiation (volume aggregation, long-term contracts) | Up to 25% on negotiable items | Minimal leverage when parts are on allocation |
The conclusion: meaningful BOM cost reduction requires procurement involvement before component selection is locked. The organizations achieving 15–30% BOM cost reduction in 2026 are those where procurement sits at the design review table, not those with the most aggressive negotiation tactics.
Strategy 1: Run a Pre-Freeze BOM Cost Risk Assessment
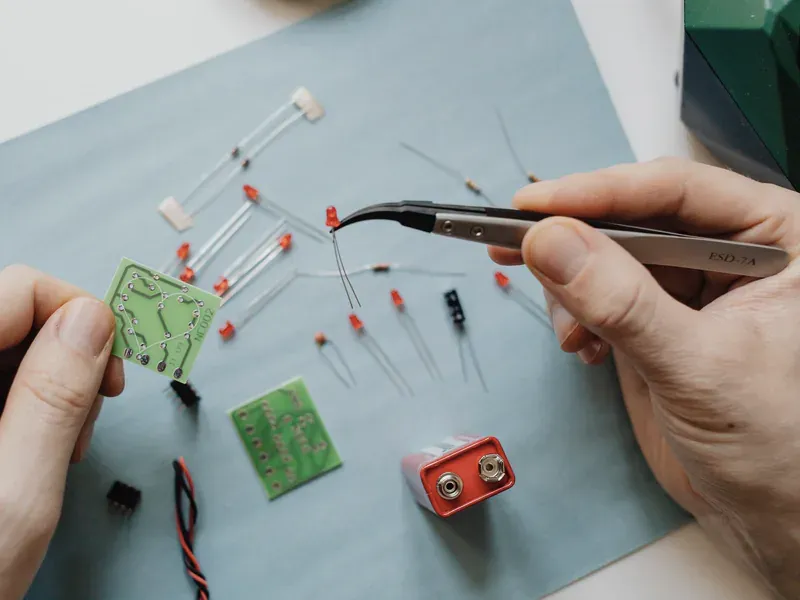
The single highest-leverage procurement intervention: before the design team completes the schematic and locks the BOM, procurement should conduct a cost risk assessment on every BOM line item. The assessment evaluates:
Component Cost Trajectory
- Is the component’s price trending up, down, or flat over the past 6 months?
- Are raw material surcharges being applied by the manufacturer?
- Are there announced price increases scheduled in the next two quarters?
Single-Source Dependency
- Is the component available from one, two, or three+ independent suppliers?
- If single-source: what would a redesign cost if this part goes EOL or on allocation?
- Is there a pin-compatible second source available today?
Lead Time Exposure
- What is the current lead time compared to your production planning horizon?
- Is the lead time trending longer or shorter?
- Is the part on allocation?
Lifecycle Risk
- Where is this part in its lifecycle (new introduction, active, mature, not recommended for new designs, EOL announced)?
- If EOL is likely within your product’s lifecycle, what is the qualification timeline for an alternative?
Tariff and Geopolitical Exposure
- Where is the part fabricated? Does it cross a tariff boundary?
- Can a trade policy change affect landed cost?
Components that score poorly on multiple dimensions (rising cost + single-source + long lead time + near EOL) are candidates for pre-freeze replacement with more supply-resilient alternatives.
Strategy 2: Apply Total Cost of Ownership (TCO) Instead of Unit Price

Procurement teams optimizing for unit price alone systematically undercount costs that appear later in the product lifecycle. A TCO analysis captures:
The same model should identify material that becomes surplus after an MOQ purchase, design change, or forecast reduction. The excess electronic component inventory guide explains how to preserve traceability and compare return, resale, consignment, and destruction routes.
| Cost Category | Typical % of TCO | Often Overlooked? |
|---|---|---|
| Unit price (at volume) | 45–65% | No |
| Buffer inventory carrying cost | 5–15% | Yes—especially for long-lead-time parts |
| Second-source qualification cost | 3–10% | Yes—amortized over production volume |
| Field failure and warranty cost | 5–15% | Yes—only visible 12–36 months after launch |
| Redesign cost from EOL | 10–30% | Yes—catastrophic when it occurs |
| Supplier management overhead | 2–5% | Sometimes—especially for fragmented supply bases |
Example: A $0.50 microcontroller alternative saves $5,000 at 10,000 units compared to a $1.00 industrial-grade part. But the $0.50 part has a 3-year lifecycle (vs. 15 years for the industrial part), requires a $50,000 redesign when it goes EOL in year 4, and has a 2% higher field failure rate generating $30,000 in warranty costs. TCO: $0.50 part = $85,000; $1.00 part = $10,000 + $30,000 buffer stock. Unit price optimization alone would make the wrong decision.
Strategy 3: Standardize Components Without Sacrificing Supply Resilience
Component standardization—using fewer unique part numbers across product lines—is a proven cost reduction strategy. It increases volume per part number, improves negotiation leverage, simplifies inventory management, and reduces procurement transaction costs.
However, standardization concentrated on a single supplier creates single-source risk. The solution is standardized multi-sourcing: standardize on a component specification, not a supplier, and qualify at least two suppliers for each standardized part number. This captures the procurement efficiency of standardization while maintaining the supply resilience of dual-sourcing.
Practical approach: Standardize passive components (resistors, capacitors, connectors) aggressively—these are multi-source commodities where standardization saves cost without adding meaningful risk. For active components (MCUs, power ICs, interface ICs), standardize on two functionally equivalent alternatives with documented qualification. For the top 10 highest-spend components, maintain a documented third-source contingency (usually through independent distribution).
Strategy 4: Design In Multi-Sourcing from Schematic Capture
The cheapest time to add multi-sourcing is during schematic capture—before the PCB is laid out. Key techniques:
- Select ICs in standard packages (QFN, TSSOP, SOIC) rather than proprietary packages that lock you to a single supplier
- Place dual footprints for critical components on the PCB, even if only one is populated in production—this costs a few square centimeters of board area but saves 8–12 weeks of PCB layout time if a supplier switch becomes necessary
- Use configurable pin-mapping in the FPGA/MCU firmware to accommodate different pinouts from alternative supplier parts
- Specify standard voltage and timing margins that allow substitution of functionally equivalent parts from different vendors
These design-for-multi-sourcing practices increase initial PCB area by 3–8% but reduce redesign cost and schedule impact by 80–90% when a supplier switch is needed. For products with firm delivery commitments and penalty clauses, this is a high-return investment.
Strategy 5: Reduce Engineering Research Time in Component Selection
One of the most underappreciated BOM cost drivers is engineering time spent researching, evaluating, and qualifying components. A senior hardware engineer spending 40 hours comparing three MCU options and reading datasheets costs roughly $4,000–6,000 in fully loaded labor—equivalent to the unit price delta across thousands of MCU units.
Practical approach: Procurement should provide pre-qualified component shortlists to engineering, not wait for engineering to specify parts and then try to negotiate cost. The procurement team’s market intelligence—which suppliers are on allocation, which parts are approaching EOL, which alternatives have shorter lead times—is the missing input that prevents engineering from selecting parts that later become supply problems. This procurement-to-engineering information flow reduces the R&D iteration cycle by 20–30% and prevents the most costly component selection mistakes.
Strategy 6: Build Real-Time Cost Visibility Infrastructure
Most procurement teams in 2026 are working with cost data that is 30–90 days old. In a market where component prices can change weekly, this lag creates systematic cost overruns.
The solution is not expensive—it is process discipline:
- Track component pricing trends monthly for the top 50 high-spend BOM items
- Monitor lead time shifts that signal upcoming allocation and price increases
- Map BOM against supplier fab locations to anticipate tariff impacts before they land
- Set price increase alerts with distributors for components where price and lead time are volatile
Organizations with real-time cost visibility reduce annual component cost escalation by 3–7% compared to organizations relying on quarterly pricing reviews.
Optimizing BOM costs in a constrained market? SupplyICs provides component cost analysis, multi-source qualification support, and independent distribution access for hard-to-find parts. Upload your BOM for a comprehensive cost risk assessment or submit an RFQ.
Frequently Asked Questions (FAQ)
What is the single most effective strategy for reducing BOM costs in 2026?
The highest-leverage strategy is engaging procurement during the design phase—before component selection is locked. By the time most organizations start BOM cost optimization, 70–90% of the cost has already been locked in by upstream design decisions (CircuitMind, December 2025). The single most effective intervention: before design freeze, procurement should run a BOM cost risk assessment that evaluates every component for cost trajectory, single-source dependency, lead time exposure, and lifecycle risk. Components on an upward pricing curve or with emerging supply constraints can be designed out while changes are still inexpensive. This pre-freeze intervention typically identifies 15–25% of BOM cost that can be reduced through alternative component selection, compared to 3–8% achievable through post-design procurement negotiation alone.
How should procurement teams evaluate total cost of ownership vs. unit price?
Total Cost of Ownership (TCO) for electronic components extends well beyond unit price. The TCO calculation should include: (1) unit price at projected volumes; (2) lead time risk—a $0.50 cheaper part with 30-week lead time may require $5,000+ in buffer inventory carrying cost; (3) lifecycle horizon—a part nearing EOL may save $0.30 today but cost $50,000+ in redesign when it goes obsolete; (4) qualification cost—single-source parts require a second-source qualification project ($20,000–100,000+); (5) field failure cost—lower-cost parts with wider specification tolerances may increase field return rates; and (6) supplier management overhead—fragmented supplier bases add procurement labor cost that often exceeds component cost savings. Procurement teams using TCO analysis reduce total component lifecycle cost by 12–20% compared to unit-price-only optimization (Accuris Technologies, June 2026).
How do I balance BOM cost reduction with supply chain diversification in a constrained market?
The tension is real: standardizing on fewer component types reduces cost but increases single-source risk, while diversifying suppliers reduces risk but fragments purchasing volume. The resolution is a tiered approach: (1) Standardize passive components (resistors, capacitors, connectors) aggressively—these are multi-source commodities where standardization saves cost without adding risk. (2) Dual-source active components (MCUs, power ICs, interface ICs) with at least one franchise and one qualified independent distributor—this adds minimal cost and substantial resilience. (3) For the top 10 highest-spend components, maintain documented alternative sources with completed qualification—the qualification cost is a one-time expense; the supply resilience is permanent. This tiered approach typically achieves 70–80% of the cost savings of full standardization while maintaining supply chain diversification.